Liên hệ quảng cáo
Research on challenges of the high latitude sea areas to ECDIS
In the light of changes in ice conditions on the Polar Regions due to the Global Warming, routes showing through ice-infested waters become of interest.
|
MS. Luu Viet Hung Dr. Tran Van Luong MS. Luong Tu Nam Vietnam Maritime University Reviewer: Ass. Prof. Dr. Nguyen Viet Thanh |
Abstract: In the light of changes in ice conditions on the Polar Regions due to the Global Warming, routes showing through ice-infested waters become of interest. Shipping activity in the Polar Regions is a complicated endeavour. What seemed impossible before because of the rough weather and thick ice is now becoming possible. This will increase transports from and to the ports in this region. However, navigation in these waters now poses challenges that will need new solutions to guarantee safety for mariners and ships. ECDIS which is the important ship navigation equipment is showing restrictions when using on the high latitude sea areas. The purpose of this research is to present the current status and weakness of using ECDIS on the high latitude sea areas.
Keywords: ECDIS, GIS, high latitude sea areas, Mercator projection
1. Introduction
The Mercator projection has been used in most cases of navigation with ECDIS.At lower latitudes, over the distances of concern to a navigator, the nonlinear divergence is of little consequence and is barely noticed. At the higher latitudes, however, the effect can be excessive and it considerably reduces the utility of the Mercator projection for navigation. As a result of these issues, the Mercator projection becomes more and more useless at higher latitudes.
Moreover, the lack of survey data or its poor quality is reflected in the charts and these data should be updated continuously to make ships keep additional safety margins when passing these areas.
2. Content
2.1. The issues of ENCs charting on the high latitude sea areas
The nautical chart has been the primary tool for mariners to identify positions and the information required for safe voyage. The cartographic skills and knowledge of the chart compilers enable the information to be depicted as accurately, plainly and unambiguously as possible so as to provide the chart users with all necessary data.Modern navigational charts are compiled from more accurate hydrographic surveys took place onboard specialized vessels. Expert information agencies combine all various sources of data into navigational charts, taking great care to guarantee the information is plain and accurate for use by the mariners.
Unfortunately for mariners trying to navigate through the high latitude sea areas, navigational information for some of those areas is similarly antique.In many areas, the chart coverage may not currently be adequate for coastal navigation [2]. The balance between capacity and demand is an increasing challenge for hydrographic offices. Systematic and completely covering hydrographic surveys on the high latitude sea areas have not achieved the same level of coverage and quality as surveys in lower latitudes due to the limited amount of marine traffic, the historical survey methods, the extremely high costs, the lack of manpower and the harsh weather conditions. The data can be unknown or in poor quality in large areas. Surveys which give the sources for a navigational chart may be from long time ago. This is also the case for electronic charts which can be based upon old paper charts. The master must be aware of what kind of chart he is navigating with and how reliable it is [3].The accuracy of charts on the high latitude sea areas can vary widely according to the date of survey.The result is that Poles charting base hydrographic data is not adequate in most areas to support current and future marine activities.
2.2. Restriction of Mercator projection on the high latitudes sea areas
2.2.1. Distortions of a projection
The distortions created during the map projection transformation may be analyzed using a measure of distortion. Below are some kind of distortions and their own formulas:
2.2.2.1. Tissot’s indicatrix
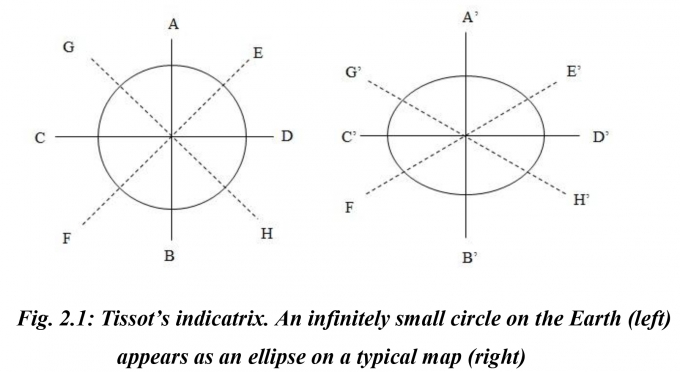 |
In Fig. 2.1, the left-hand drawing shows a circle represents the infinitely small circular element, crossed by a meridian λ and parallel φ on Earth. The right-hand drawing shows this same element as it may appear on a typical map projection. For general purposes, the map is assumed to be neither conformal nor equal-area.
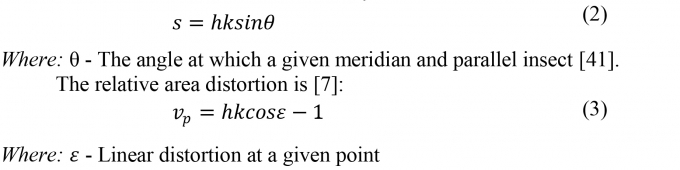
2.2.2.2. Scale distortion
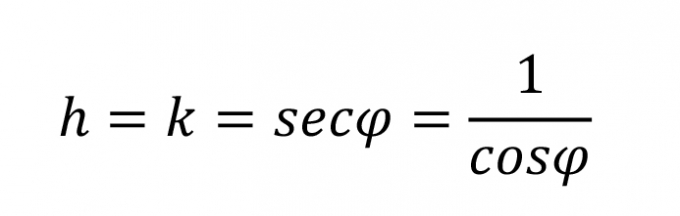
Scale distortion is most often calculated as the ratio of the scale along the meridian or along the parallel at a given point to the scale at a standard point or along a standard line, which is made true to scale. These ratios are called scale factors. That along the meridian is called h and along the parallel, k.
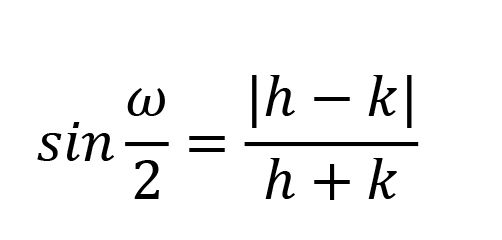
2.2.2.3. Angular distortion
Conformal projections are those that maintain angular relations (directions and angles are correct). To do this, the scale factor must be constant in every direction at every point, but then the scale factor varies from 1; therefore, lose equal-area. If a projection is conformal, parallels and meridians will always meet at right angles (but not reverse).
If meridians and parallels intersect at right angles, maximum angular deformation ω may be calculated from formula 2.1, substituting h and k in place of a and b [6].
 |
(1)
2.2.2.4. Areas distortion
Equal-area or equivalent projections are those in which regions are portrayed in their correct relative sizes. This is done by designing a transformation such that the product of the scale factors in the principal directions always equals 1. This means that at most points, the scale factors are not equal in different directionsEqual-area or equivalent projections are those in which regions are portrayed in their correct relative sizes. This is done by designing a transformation such that the product of the scale factors in the principal directions always equals 1. This means that at most points, the scale factors are not equal in different directions, therefore conformality is lost.
The area scale factor is calculated by formula as follows:
 |
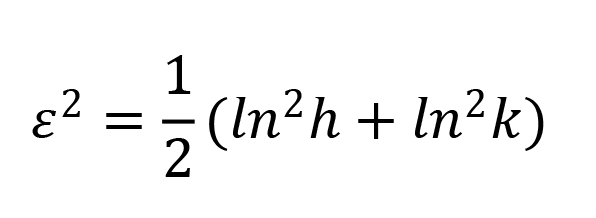
2.2.2.5. Linear distortion
It is also necessary to distinguish relative linear distortion at a given point along all directions. The general value of relative linear distortion at a given point along all directions is expressed by formulas suggested Airy-Kavrayskiy criterion[7]:
 |
(4)
2.2.2. Distortions of Mercator projection on the high latitude sea areas
Its distinguishing feature is that both the meridians and parallels are expanded at the same ratio with increased latitude to infinity at the poles. The expansion is equal to the secant of the latitude, with a small correction for the ellipticity of the Earth. In spherical form of the Earth with the Equator as the standard parallel, formulas of scale factor along meridians and parallels are as follows:
 |
(5)
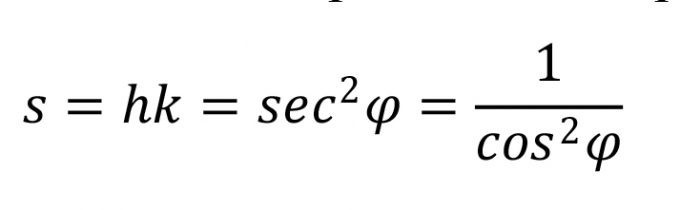
The area scale factor is the product of the parallel and meridian scales:
 |
(6)
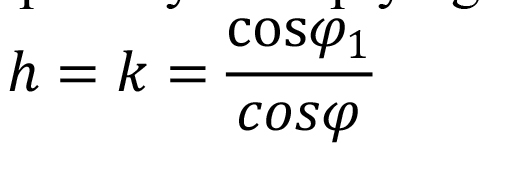
In the case, another parallel is chosen as the standard parallel, the scale will be different. If latitude is set as the standard parallel, the above formula of scale factor is adapted by multiplying the right side by .
 |
(7)
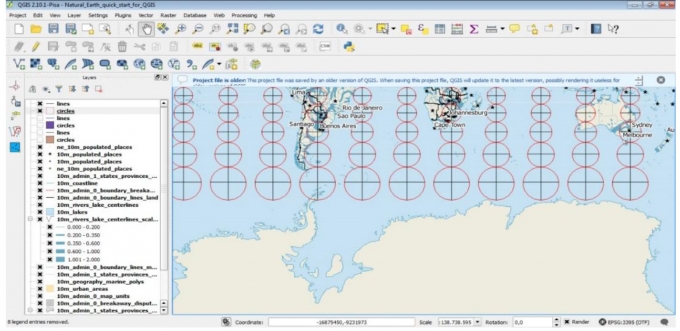
In Mercator’s conformal projection, all Tissot’s indicatrixs remain circular in shape. Areas are not preserved, but greatly increase towards the top and bottom of the map: circles at the poles would be infinitely large. Fig. 2.2 and 2.3 are representing Tissot’s indicatrixs of the Mercator projection in sea areas near the North Pole and the South Pole, respectively (the red circles):
 |
| Fig. 2.2: Tissot’s indicatrixs of the Mercator projection in the North Polar Region |
 |
| Fig. 2.3: Tissot’s indicatrixs of the Mercator projection near the South Polar Region |
Another serious visual distortion of Mercator projection generated is representing. Distance from point A to point C seems further than from point B to C and from point A to D. Actually, on the sphere, these distances are equal because C and D are only one point (the North Pole).
The Mercator projection shows its disadvantages in polar areas. In these areas, the meridians are converging to the poles, this is different with the charts in lower latitudes which have meridians perpendicular to the parallels. The convergence of the meridians makes it inappropriate or impossible to determine directions as well as a compass line will be curved and differ considerably from a great circle, even at short distances. Visual bearings are also only with inadequate accuracy. The poles cannot be represented on the Mercator projection. All meridians can be projected, but the upper and lower limits of latitude are approximately 80°N and S.
3. CONCLUSIONS AND RECOMMENDATIONS
Result conclusions: The results of the distortions data analysis showed that the Mercator projection is unreliable for navigation with ECDIS in these areas, and that the hazardous impact of incorrect attribution increases as the latitude increases.For the display of ENCs on the ECDIS screen the employment of the Mercator projection has two basic disadvantages: inadequacy to depict ENCs at the high latitudes and extremely large area distortion.
References
[1]. International Maritime Organization. Resolution A.817 (19), Performance Standards for Electronic Chart Display and Information System (ECDIS), Adopted on 23 November 1995.
[2]. The Maritime Safety Committee, International Code for Ships Operating in Polar Waters (Polar Code), Adopted on 21 November 2014.
[3]. Ice-Advice for trading in the Polar Regions, The Swedish Club, 2014.
Tag:


Bình luận
Thông báo
Bạn đã gửi thành công.